
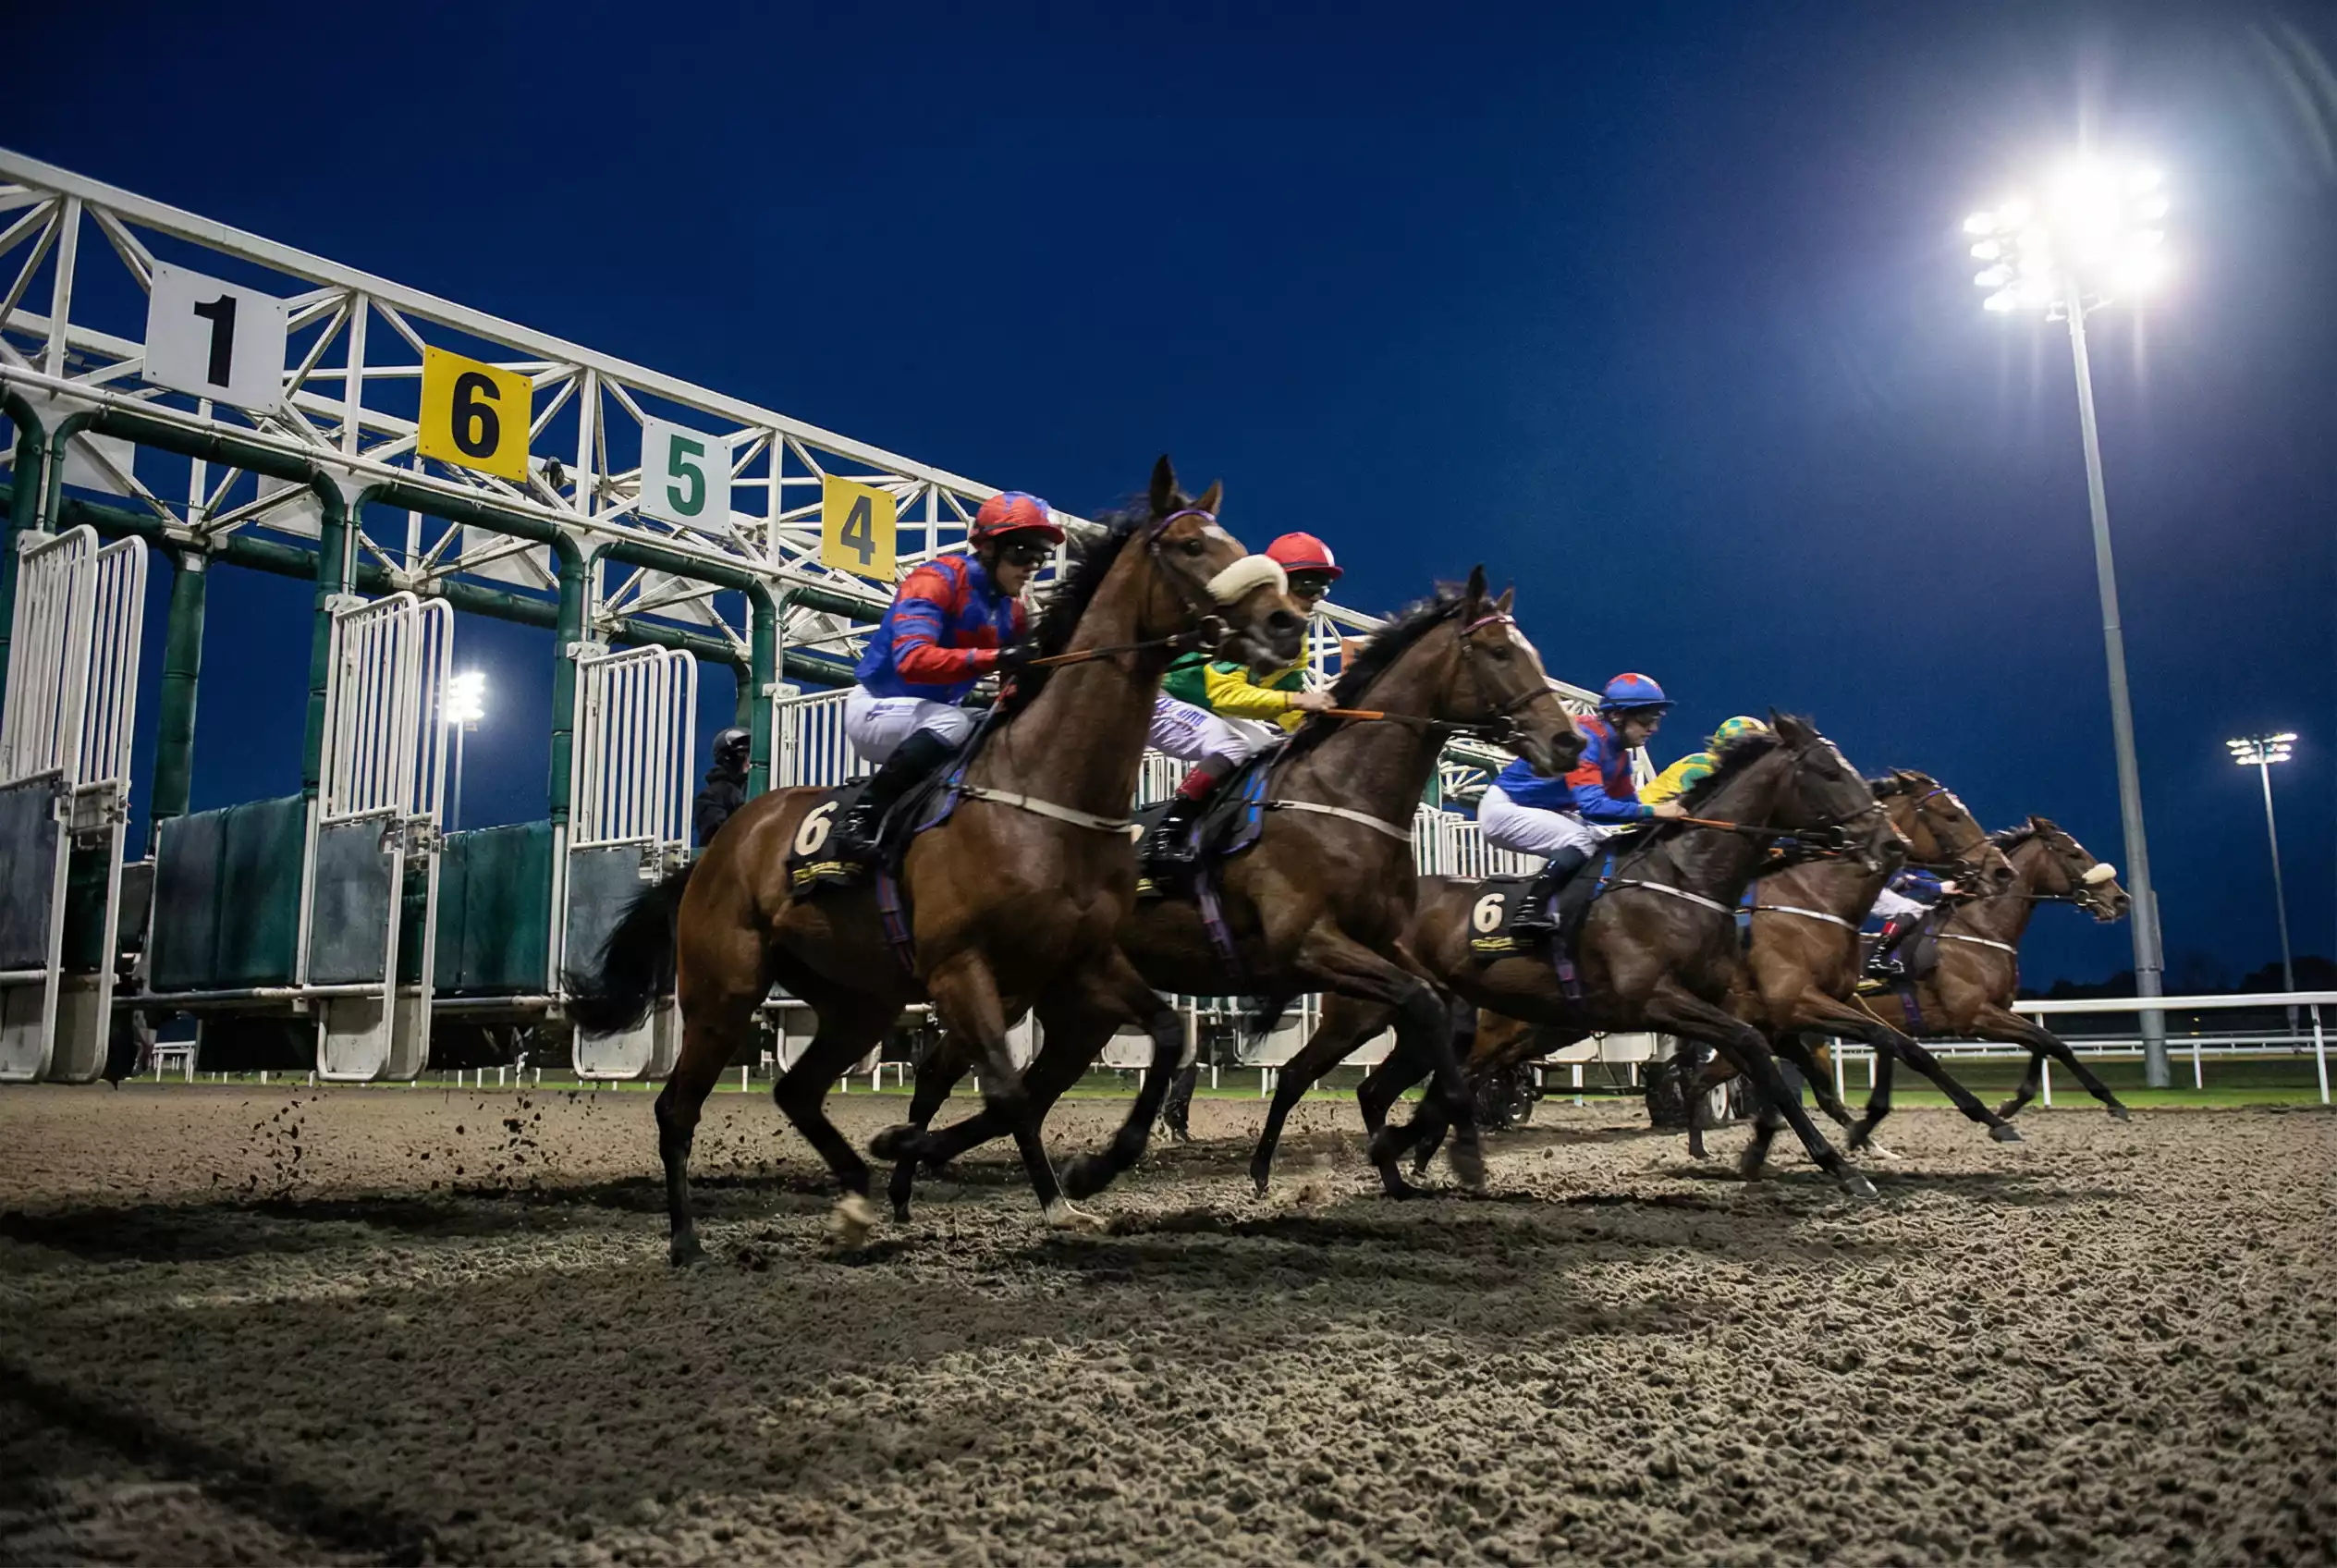
- Why Stall Position Changes Everything at Wolverhampton
- How We Measured Draw Bias
- 5-Furlong Draw: Low Stalls Rule Big Fields
- 6-Furlong Draw: The Symmetric Exception
- 7-Furlong Draw: The Stall 9 Trap
- 1 Mile and Beyond: Wolverhampton's Strongest Bias
- How Field Size Amplifies or Erases the Draw
- Data Improves Selections, Not Eliminates Risk
Best Horse Racing Betting Sites – Bet on Horse Racing in 2026
Loading...
Why Stall Position Changes Everything at Wolverhampton
Imagine backing a horse at 5/1 in a seven-furlong handicap at Wolverhampton. It has the form, the jockey booking looks strong, and the trainer’s strike rate at the course is above average. Then the stalls are drawn, and your horse lands in stall nine. Over the last five years, that single stall position on seven furlongs at Wolverhampton has produced a level-stakes loss of minus 287.42 points. Your selection didn’t become worse overnight — but the draw just tilted the odds against it in a way that most casual punters never quantify.
Draw bias at Wolverhampton is not a subtle background factor. On certain distances, it is the most significant variable in the race. The course is a left-handed oval, roughly a mile in circumference, with tight bends that compress the field and reward runners that can secure a position on the inside rail early. At distances where the starting stalls sit on a bend or close to one, the geometry of the track hands low-drawn horses an immediate advantage: they have a shorter distance to travel to the rail, less ground to cover through the turn, and a clearer passage into the home straight.
As one jockey put it in an At The Races course guide: the 5f, 7f and extended 1m starts can be tricky from a riding perspective, because they are very much draw-dependent, and it is a significant advantage to be drawn among the low numbers on the left-hand side. That assessment comes from someone who rides the track regularly, and it aligns precisely with what the data shows across thousands of races.
This analysis covers every racing distance at Wolverhampton — five furlongs through to a mile and beyond — with stall-by-stall profitability data, the counter-intuitive exception at six furlongs, and a breakdown of how field size either amplifies or neutralises the draw effect. Understanding draw bias at Wolverhampton is not a nice-to-have supplement to form study. It is the foundation of it. The data doesn’t just suggest patterns — it reveals structural advantages and disadvantages that are baked into the course layout, and that persist regardless of the quality or class of the field.
How We Measured Draw Bias
Draw bias analysis is only as good as its methodology, and a surprising number of guides get it wrong. The most common error is reporting raw win counts by stall position without adjusting for the number of runners in each stall. Stall one runs in every race; stall twelve only runs in fields of twelve or more. If you simply count winners, low stalls will always look better, because they’ve had more opportunities. That’s arithmetic, not analysis.
The metric that corrects for this is level-stakes profit (LSP) — the profit or loss you would generate by backing every runner from a given stall at starting price, to a one-point level stake. LSP normalises for opportunity count and market expectations simultaneously. A stall with a positive LSP hasn’t just produced winners; it has produced winners at a rate that exceeds what the betting market priced in. A stall with a deeply negative LSP has consistently underperformed market expectations, which means the draw disadvantage is real and not already accounted for in the odds.
The data in this analysis spans five years of racing at Wolverhampton, covering all flat fixtures on the Tapeta surface. Five years provides a large enough sample to smooth out short-term variance — individual horses, freak results, tactical anomalies — while remaining recent enough to reflect the current surface and course configuration. Results are broken down by distance, because the starting position of the stalls varies with the trip, and each starting point interacts with the course geometry differently.
We also use data from DrawBias.com, which provides visual distribution charts and statistical significance testing for draw patterns, and from OLBG, which publishes stall-by-stall LSP figures for UK courses. Where the two sources converge on the same conclusion — which, at Wolverhampton, they do consistently — we can be confident the patterns are genuine rather than artefacts of sample noise. Where they diverge, we flag the uncertainty.
5-Furlong Draw: Low Stalls Rule Big Fields
The five-furlong start at Wolverhampton sits on the home turn, which means the field immediately enters a left-handed bend within the first furlong. Runners drawn high — in stalls eight, nine, ten and beyond — face an immediate geometric disadvantage: they must either use energy to cross the field and secure a rail position, or accept racing wide through the turn and covering extra ground. In small fields, competent jockeys can manage this. In large fields, the disadvantage becomes structural.
The data from DrawBias.com confirms a statistically significant low-draw advantage at five furlongs in fields of ten or more runners. This is the only sprint distance at Wolverhampton where the draw bias passes conventional significance thresholds in big fields. In smaller fields — seven runners or fewer — the bias largely disappears, because there is enough space on the track for high-drawn horses to slot in without losing meaningful ground.
The mechanism is straightforward. On the turn, the inside rail is the shortest path. A horse drawn in stall one can hug the rail from the gate and maintain its position with minimal effort. A horse drawn in stall ten has to either angle left across the field — risking interference and expending energy in a race where every length of effort counts — or swing wide through the bend and surrender two, possibly three lengths of ground. Over five furlongs, where the winning margin is frequently less than a length, that ground loss is often the difference between collecting and watching from behind.
Level-stakes profit data reinforces the point. Stalls one through four have been consistently profitable at five furlongs over the last five years, while stalls nine and above show persistent losses. The effect is most pronounced in handicaps, where the field size tends to be larger and the ability range narrower, meaning a positional disadvantage is harder to overcome through sheer class. In conditions races and novice events with smaller fields, the draw effect is diluted — partly because the fields are smaller, and partly because better-quality horses can overcome a stall disadvantage more easily.
There is a tactical nuance worth noting. Jockeys drawn high at five furlongs will sometimes attempt to jump quickly and cross to the rail before the bend, essentially converting a high draw into a rail position by speed. This works when the horse has natural early pace and the jockey executes it cleanly, but it carries a cost: the burst of speed required to cross the field from a standing start takes energy that would otherwise be conserved for the finish. Even when the manoeuvre succeeds, the horse has spent more fuel than an equivalently positioned low-drawn rival, and that deficit tends to show in the final half furlong.
For bettors, the five-furlong draw at Wolverhampton is a filter, not a verdict. A good horse drawn high in a small field can still win comfortably. But in handicaps with ten or more runners, the data is clear: low stalls carry a structural edge, and high stalls face a structural penalty. If your selection is drawn in double figures in a big five-furlong field, you need to ask whether its other credentials are strong enough to overcome a handicap that the course layout imposes before the tapes even rise.
6-Furlong Draw: The Symmetric Exception
If the five-furlong data primes you to expect a low-draw advantage at every sprint distance, six furlongs will correct that assumption. The six-furlong start at Wolverhampton is positioned on the back straight, giving runners a lengthy run before they encounter the first bend. That straight approach changes the dynamics entirely. Horses drawn high have time — two furlongs of it — to find their position before the track geometry starts to matter. And the data shows it.
Analysis from DrawBias.com reveals a near-symmetrical distribution of winners across stall positions at six furlongs. There is no statistically significant draw bias at this distance. Low stalls win roughly in proportion to their frequency of appearance, and high stalls do the same. The distribution chart is almost flat — a sharp contrast to the lopsided profiles at five furlongs and one mile.
That said, the absence of an overall bias does not mean every stall performs identically. Individual stall positions can show notable deviations over a five-year sample. Stall five, for instance, has been the single most profitable position at six furlongs, with an LSP of +65.42 over the last five years according to OLBG data. Whether that reflects a genuine positional advantage or a statistical artefact of the particular horses that happened to draw stall five is debatable. The point is that it sits within a broader context of no systematic directional bias — stall five’s profitability is not part of a gradient from low to high, but an outlier in an otherwise balanced dataset.
The reason for the symmetry is mechanical. Because the six-furlong start is on a straight section of track, no stall position is inherently closer to the rail at the point where the field first meets a bend. By the time runners reach the home turn, they have had ample opportunity to settle into their preferred positions, and the field is typically strung out enough that the inside rail is accessible to runners drawn across the full width of the stalls. The bend doesn’t compress the field in the same punishing way it does over five furlongs or seven.
For bettors, the six-furlong draw at Wolverhampton is essentially neutral territory. You can assess form, pace, trainer intent and class without needing to apply a draw overlay. That makes six-furlong races arguably the purest form test on the card — the distance where outcomes are most likely to reflect the genuine ability of the horse rather than the accident of the stall allocation. If you’re looking for races where traditional form study holds the most weight, six furlongs at Wolverhampton is where to start.
7-Furlong Draw: The Stall 9 Trap
Seven furlongs at Wolverhampton is where the draw starts to bite again — and one stall position in particular stands out as a graveyard for punters’ money. Stall nine on seven furlongs has produced a level-stakes loss of minus 287.42 points over the past five years, according to OLBG data. That is not a mild underperformance. It is a catastrophic, sustained destruction of value that persists across different trainers, different jockeys and different class levels.
The seven-furlong start sits on the apex of the far bend, which creates a specific positional problem. Runners drawn in the middle-to-high stalls are launched directly into the curve, and the wider they are drawn, the more ground they lose through the first two furlongs. But stall nine occupies a particularly awkward position: it is far enough from the rail that the jockey cannot easily secure an inside berth, but not far enough out that the rider can commit to racing wide with a clear run. It is the worst of both worlds — a position that invites indecision, because neither option is clean.
Jockeys drawn in stalls one through four can settle on the rail without fuss. Jockeys drawn in stalls eleven or twelve know they’re wide and can ride accordingly, accepting the wider path and pushing for the lead to offset the ground loss. Stall nine sits in the no-man’s-land between these two strategies. The rider either tries to ease across to the rail — burning energy in the process and risking being shuffled back — or accepts a mid-track position through the bend, covering extra ground without the compensation of a clear run on the outside. The LSP data suggests that both options fail more often than they succeed.
The broader seven-furlong draw pattern follows a modified version of the five-furlong template: low stalls have an advantage, high stalls are penalised, and the effect intensifies with field size. But the gradient is less steep than at five furlongs, because the longer distance gives jockeys more time to recover from an unfavourable draw. A horse drawn wide at seven furlongs has five or six furlongs of racing left after the initial bend; at five furlongs, the bend eats into the race almost immediately, leaving no recovery time.
What makes the seven-furlong data particularly useful for bettors is the specificity of the stall nine anomaly. Generic draw advice — “low numbers are better” — understates the reality. It is not just that low stalls are marginally more profitable; it is that one specific middle-draw position is dramatically, consistently unprofitable. If your selection draws stall nine in a seven-furlong race at Wolverhampton, the historical data gives you a concrete reason to lower your stake or look for an alternative. That is the kind of granular, actionable insight that separates data-driven betting from guesswork.
1 Mile and Beyond: Wolverhampton’s Strongest Bias
If the draw matters at five furlongs and bites at seven, it dominates at one mile. The one-mile start at Wolverhampton — officially 1m 141y — produces the strongest draw bias of any distance on the course, and it is one of the most pronounced stall-position effects at any all-weather track in Britain. According to DrawBias.com, the advantage for low-drawn horses at this distance is both statistically significant and large enough to materially affect betting outcomes.
The reason lies in the starting position. The one-mile gate is on the home bend, beyond the winning post but before the turn into the back straight. Runners break from the stalls and immediately face a left-handed curve that feeds into the far straight. Horses drawn low — stalls one, two, three — can slot onto the rail within strides of leaving the gates. Horses drawn high must either cross the entire field to reach the rail, losing ground and energy in the process, or accept racing wide through a bend that adds measurable yardage to their journey.
At one mile, unlike at five furlongs, there is no short-course mitigation. The race is long enough that the ground lost on the first bend compounds. A horse that races two paths wide through the opening turn covers roughly four to five extra lengths of ground. Over five furlongs, that penalty is absorbed in approximately one second of running time. Over a mile, the horse carries the positional deficit for the entire race, and it tells in the closing stages — particularly in handicaps, where the runners are closely matched on ability and the draw advantage becomes the decisive margin.
The LSP data at one mile shows a clear, steep gradient from low to high. Stalls one and two are consistently profitable. Stalls three and four are close to break-even or marginally positive. By stall seven or eight, the numbers tip into persistent loss territory. And in the double-figure stall positions, the losses are substantial. This is not a vague trend or a marginal statistical edge — it is a pronounced, durable structural bias that has held up across thousands of races and multiple racing seasons.
Beyond the straight mile, Wolverhampton also stages races at 1m 1f and 1m 4f. These longer distances start from different positions on the track, and the draw bias varies accordingly. At 1m 1f, the start moves further around the course, giving runners a slightly longer straight before the first bend. The low-draw advantage persists but is less extreme than at the straight mile. At 1m 4f, the starting position and additional distance further dilute the draw effect, because the field has more time to sort itself out and the race contains multiple bends rather than one decisive turn.
The critical distance for draw-aware bettors is the straight mile. This is where the bias is strongest, where the data is most robust, and where the failure to account for stall position costs the most money. If you back horses at 1m 141y at Wolverhampton without checking the draw, you are ignoring the single most predictive piece of pre-race information available. Every selection at this distance should start with a stall check: if the horse is drawn low, the bias is working for you; if it’s drawn high, you need a compelling reason to believe the horse can overcome a handicap that the course itself imposes.
It is worth noting that the market does partially price in the one-mile draw bias — high-drawn horses tend to drift in the betting, and low-drawn horses tend to shorten. But the adjustment is incomplete. The LSP data shows that low stalls remain profitable even after the market has accounted for their advantage, which means the bias is underpriced. That is the definition of a value angle: a structural edge that the market recognises but does not fully capture.
How Field Size Amplifies or Erases the Draw
Draw bias does not operate in a vacuum. It interacts with field size in a relationship that every serious Wolverhampton bettor needs to understand: bigger fields amplify the bias; smaller fields neutralise it. This pattern holds across all distances where a bias exists, and it is the single most important contextual variable when applying draw data to a specific race.
The logic is intuitive. In a field of five, there is room for every runner to find a comfortable position without being squeezed by rivals. A horse drawn in stall five — the widest in a five-runner field — still has a relatively short distance to travel to the rail, and there are few enough competitors that finding a gap is straightforward. The draw barely matters. In a field of fourteen, the same stall five is surrounded by runners on both sides, the rail is several horse-widths away for anyone drawn in the middle or high, and the first bend becomes a congested bottleneck where positional advantage translates directly into racing advantage.
The average flat field size in Britain during 2025 was 8.90 runners, according to the BHA’s 2025 Racing Report. Wolverhampton’s field sizes vary by race type — handicaps tend to attract larger fields than conditions races or novice events — but the overall average is broadly in line with the national figure. For draw bias purposes, the critical threshold is roughly eight to nine runners. Below that, the draw effect at most distances is marginal and can usually be disregarded. Above it, the effect kicks in progressively, reaching its maximum in fields of twelve or more.
This creates a practical framework for race-by-race assessment. When the declarations come through and you see a twelve-runner handicap at five furlongs, the draw should be one of the first things you check. When you see a five-runner conditions stakes at the same distance, the draw can safely be deprioritised in favour of form, class and trainer intent. The data doesn’t just tell you that a bias exists — it tells you when it matters.
The field-size interaction also explains some of the apparent contradictions in draw studies. A punter who looks at overall five-furlong statistics and sees a modest low-draw advantage might conclude that the bias is weak. But that aggregate figure blends together small-field races (where the bias is absent) with big-field races (where it is strong), producing a diluted average that understates the true effect in the races where it actually applies. Segmenting the data by field size reveals the real picture: no meaningful bias in small fields, substantial bias in large ones.
For bettors who like to build systematic approaches, field size is the on-off switch for draw strategy at Wolverhampton. In any race with nine or more runners at five furlongs, seven furlongs or one mile, the draw filter should be active. In smaller fields, it can be switched off. That simple rule captures most of the value embedded in the draw data without requiring you to memorise stall-by-stall LSP tables for every possible field configuration. Keep it simple, apply it consistently, and the edge compounds over time.
Data Improves Selections, Not Eliminates Risk
Data and analysis can improve your selections, but they cannot guarantee a profit. Every bet carries risk, and even the strongest statistical edge will produce losing runs. The foundation of sustainable betting is discipline: set a fixed bankroll, stake consistently, and never increase your bets to chase losses. If a losing run makes you feel anxious or compelled to bet more, that is a signal to stop, not to escalate.
Licensed UK bookmakers are required to offer tools including deposit limits, session time reminders and self-exclusion. Use them proactively — they are designed to keep betting within the bounds of entertainment. If gambling stops being enjoyable, organisations like BeGambleAware and GamStop offer free, confidential support. The National Gambling Helpline is available 24 hours a day on 0808 8020 133.